
Understanding BizTalk Oracle Adapter Perfmon Counter and Removing Performance Bottlenecks by Creating Low Latency System

Time to Read: 8 minutes
Problem
Recently I was working on a complex project where I was working on an orchestration which executes a stored procedure in an oracle database. The stored procedure has a simple select query that brings back data for a particular id. We executed the stored procedure from BizTalk using standard WCF-Custom adapter with oracle binding. The stored procedure when executed from a client like sqldeveloper, would take some where around 600 ms to a second, but when the same was executed from BizTalk application it would take some where around 10 to 20 secs on average. Now as our application was supposed to be a fast application and the whole process of BizTalk was supposed to take 20 secs but due to the stored procedure issue the call was taking around 25 secs and was unacceptable according to business.
So I embarked upon the journey to check the performance issues with the stored procedure execution and to fix them using whatever means necessary viz code changes or performance tuning.
Following are my observations and findings which include
- How to trace performance counter of oracle adapter
- Understanding the actual meaning and behavior of the performance counter
- Identifying the bottleneck and finally,
- Fixing the bottleneck by tweaking the Host properties.
How To Enable Performance Counters for Oracle adapter?
As per the MSDN documentation, the oracle adapter for BizTalk only has one performance counter “LOB Time” and this is defined as
“The BizTalk .NET Adapter for Oracle DB category has one performance counter called the “LOB Time (Cumulative).” This performance counter denotes the time, in milliseconds, that the LOB client library takes to complete an action that the adapter initiates”
source: MSDN Documentation: Use performance counters with the Oracle Database adapter
Let us take a look at how to enable the performance counter and how to collect it in data collector set.
The performance counter collection should be enabled on the send port level. Following snap shot shows how to do that
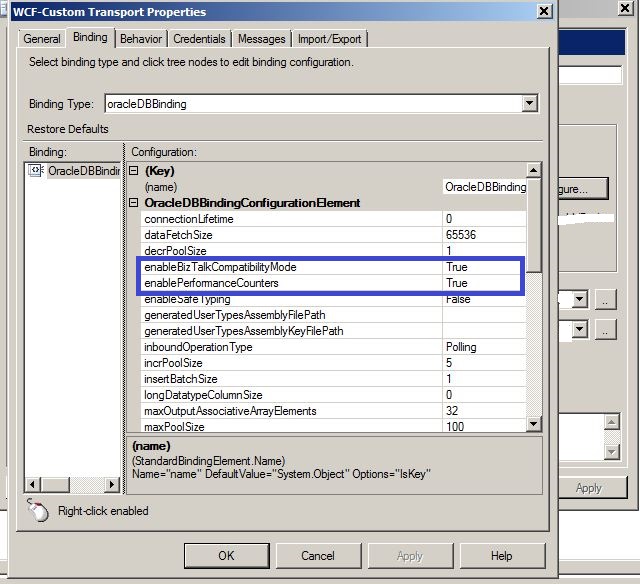
As we are using the oracle adapter with a BizTalk application the enableBizTalkCompatibilityMode should be set to True. Also enablePerformanceCounters when set to True will allow us to collect the performance counter LOB Time when the actual stored procedure is invoked by the adapter.
In order to track the LOB Time and save data collection, we need to set up a data collector set.
Following is a step by step process to set up the data collector set.
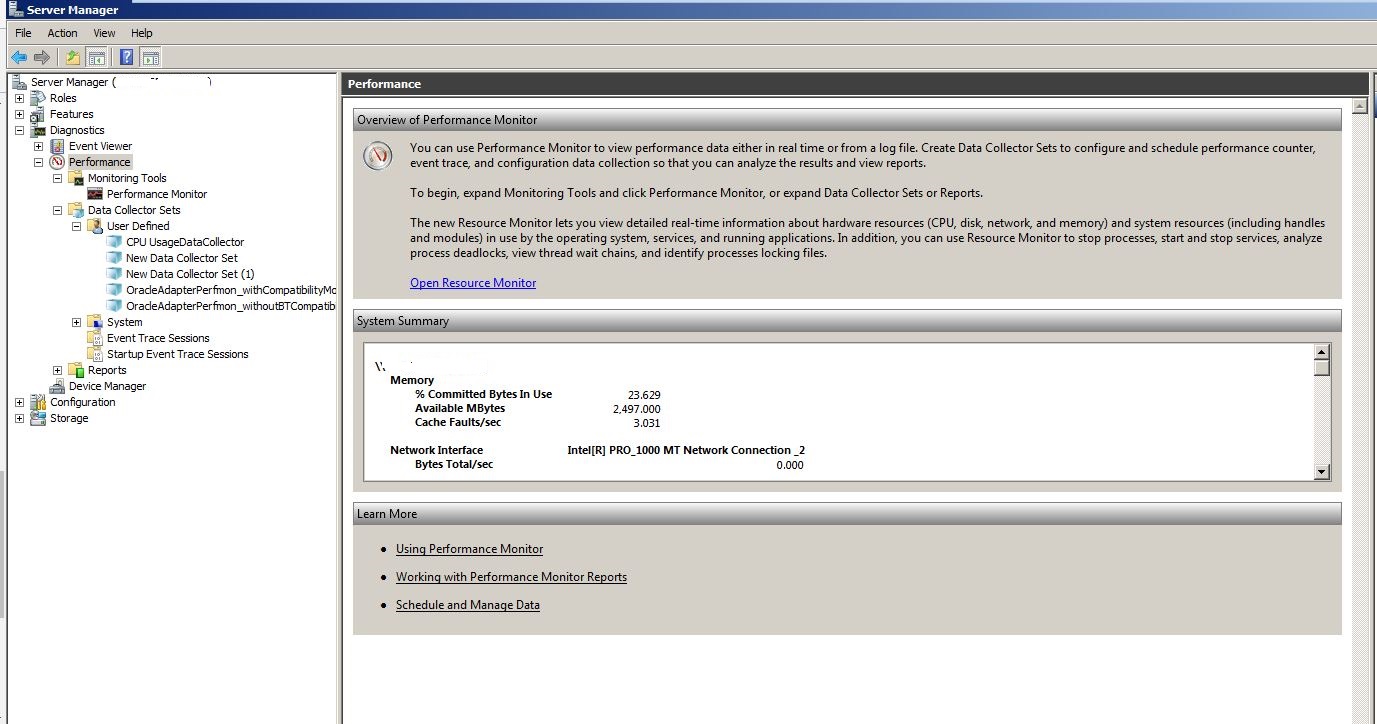
- Go to server Manger and click on Performance
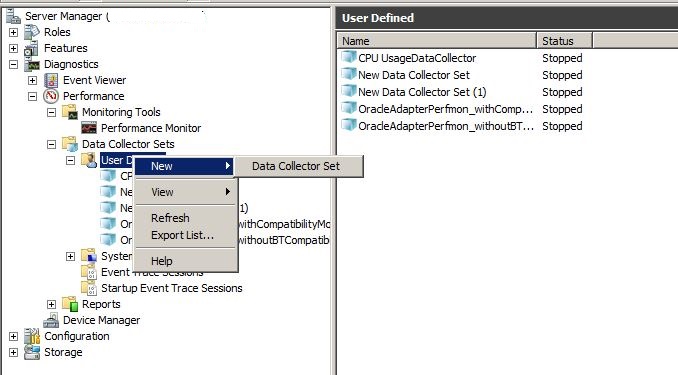
- Click on the User Defined under the Data Collector Set to create a new data collector set.
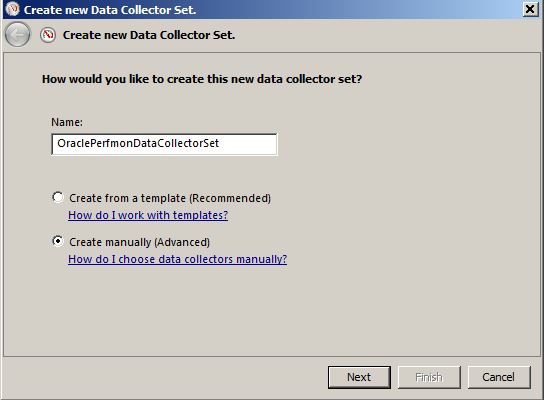
- Give a meaningful name to the collector set and select the Create Manually(Advanced) option and click on Next
- Select the Create data logs option and check the Performance Counter check box
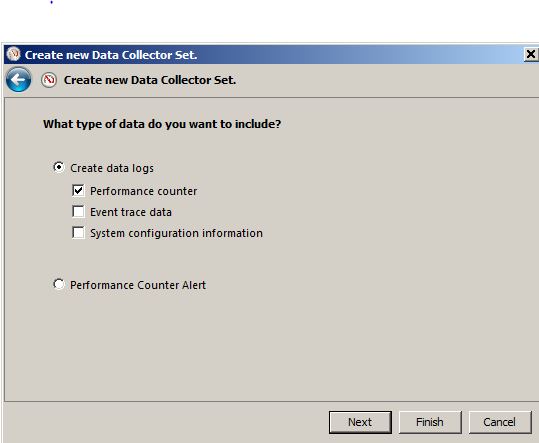
- Click on the highlighted Add option to see the list of available performance counters.
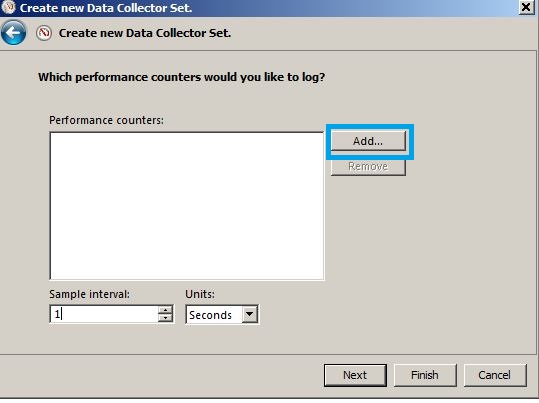
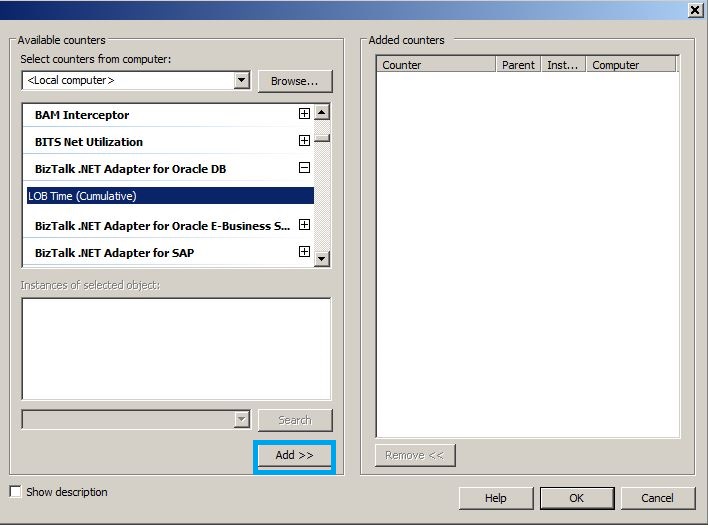
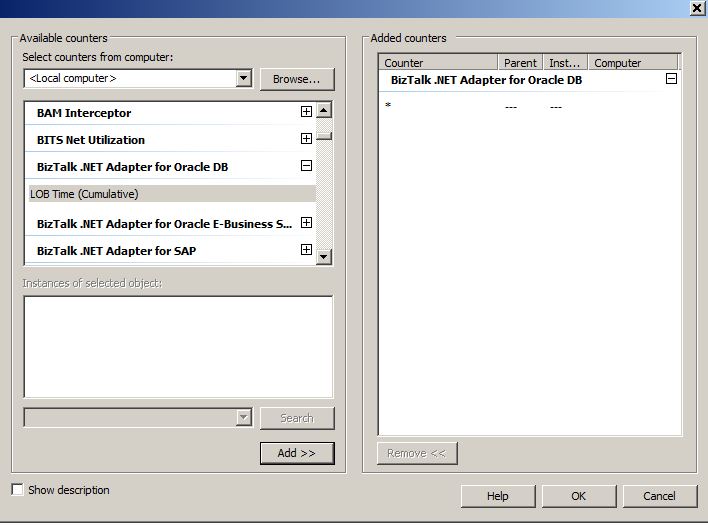
- Select the LOB Time(Cumulative) performance from under the BizTalk .NET Adapter for Oracle DB and click on Add. It gets added to the Added Counters section on left and your data collector will collect the data for this perfmon counter now.
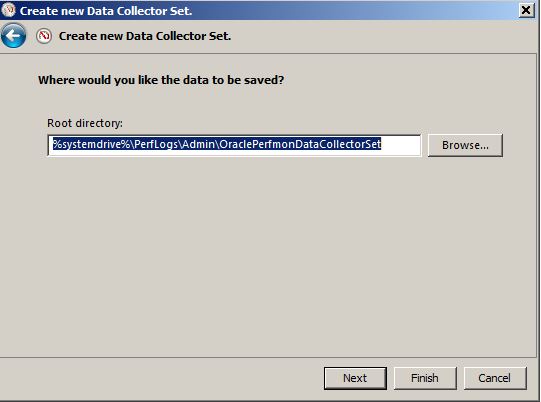
- Once you click on Ok, you will be asked where the collected data needs to be saved. Save it as per your convenience.
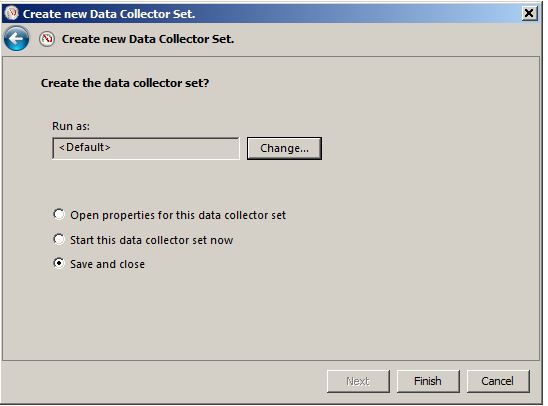
- Click on Finish and it will ask how to run the data collector set, since I am already an admin on my machine, I allow it to run as default.
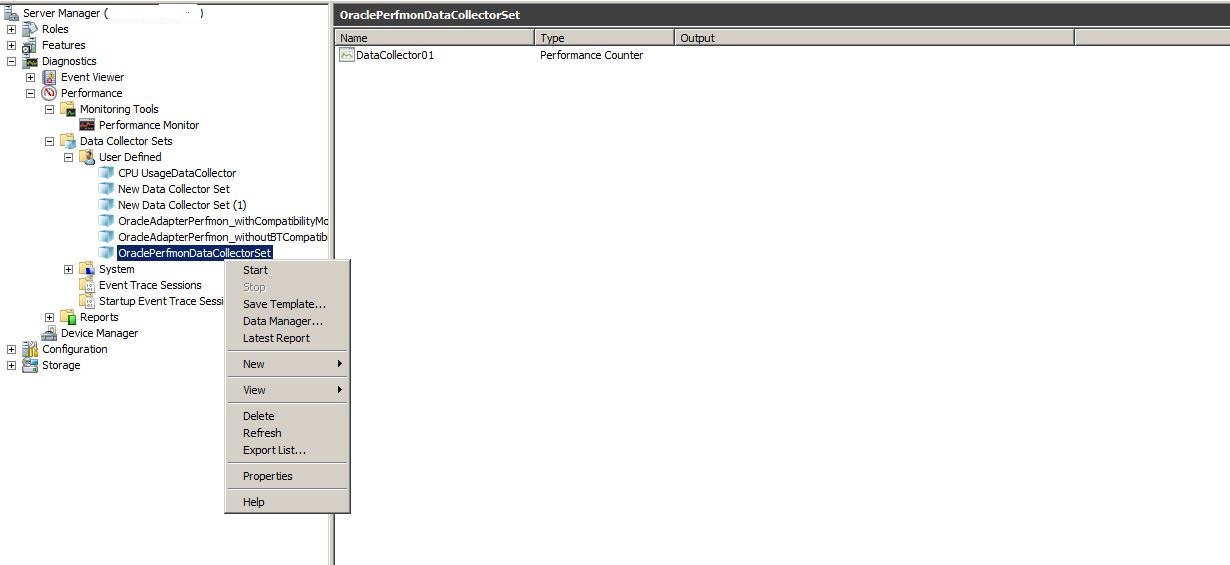
- Once clicked on Finish the collector will be available under the User Defined Data Collectors. Once you are ready to collect the data you can start the collector
Understanding the actual meaning and behavior of the performance counter
As mentioned on the MSDN documentation the Oracle adapter has only one counter called as LOB Time which measures the time taken by the LOB client library to perform the action initiated by the adapter and it is tracked in milliseconds. But notice the Cumulative added to the performance counter name. The reason is that this counter tracks the cumulative time for the next iteration. Let us see what this means
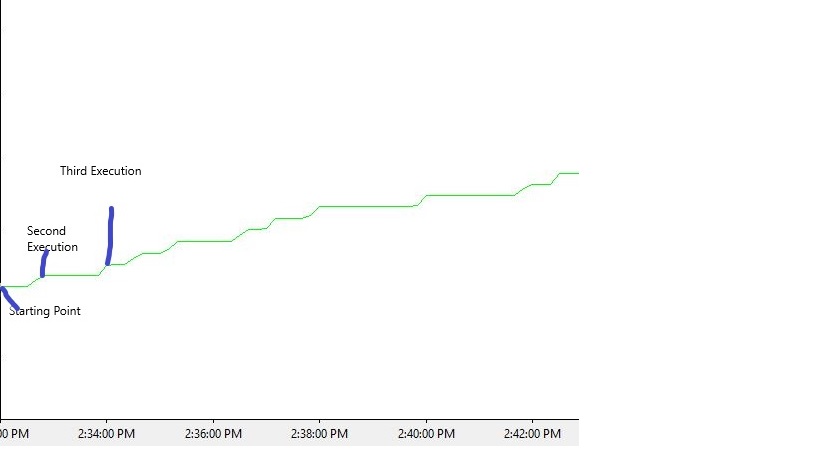
Let us say that a call to an oracle stored procedure is initiated at 12:00:00 PM so at start the counter value will be o ms. Once the call gets complete. the counter value gets updated say it takes 200 ms to complete the action. so the counter reaches the value of 200 ms now. So when the next call happens at that point the counter will not start again from zero, it will be constant on 200 ms and the next call duration gets added to 200 ms. So say second call takes another 200 ms then in that case counter becomes stable at 400 ms.
So as opposition to a spiked behavior of the counter what we see is a step behavior, hence the counter is a cumulative counter as at any current point of time, it denotes the cumulative time from all the previous time. Following snap shot which tracks one cumulative LOB time will make the concept clear.
So after this I started the collection of the data on the box and fired up some requests to the BizTalk application.
Now from tracked data , I calculated the time duration between the send and receive activity of the oracle send port and the time captured using the performance counter. Following is sample data(LOB time is the difference between to steps in performance counter)
| Port Execution Duration as noted from DTA Db(ms) | LOB Time(ms) |
| 20500 | 1529 |
| 7000 | 1607 |
| 5800 | 1451 |
| 19300 | 1497 |
As seen there is vast difference between the execution times tracked from DTA and the LOB time, it became clear to me that there is nothing wrong with the performance of the oracle adapter whatsoever. so next task was to fins out what was wrong and the big question was where??
After doing a bit of reading around the BizTalk performance counters, I came across following counters available under the BizTalk:Messaging Latency object.
Outbound Adapter Latency : This performance counter is available under the BizTalk:Messaging Latency object and is described in MSDN documentation as
“Average latency in milliseconds from when the adapter gets a document from the Messaging Engine until the time it is sent by the adapter.”
Inbound Latency: This performance counter is available under the BizTalk:Messaging Latency object and is described in MSDN documentation as
“Average latency in milliseconds from when the Messaging Engine receives a document from the adapter until the time it is published to Message Box”
These performance counters were enabled(Only for the send handler attached to the port executing oracle stored procedure under question) and then again data was collected using the collector sets. Following is a snap shot of all the three performance counters collected together.
![]()
As it is clear each time there is a call to the stored procedure there will simultaneous peaks for the Outbound Adapter Latency and the Inbound Latency. Let us take a look at the data collected.
| Port Execution Duration from DTA Db(ms) | LOB Timeout(ms) | Outbound Adapter Latency(ms) | Inbound Latency(ms) | Total Duration(ms) |
| 20500 | 1529 | 16941 | 2106 | 20576 |
| 7000 | 1607 | 4196 | 1202 | 7005 |
| 5800 | 1451 | 3947 | 437 | 5835 |
| 19300 | 1497 | 16302 | 1529 | 19328 |
Now when we add the LOB Time, Outbound Adapter Latency and the Inbound Latency for a particular stored procedure execution they match up with the data recorded in the DTA table.
So Finally !!! Success , well partly because I found out that the issue was due to the Latency in BizTalk messaging. Bottleneck identified and half the battle is already won.
Fixing the BottleNeck
Armed with observations made from the performance counters, I took on the task of the fixing the bottle neck. Theoretical solution to the latency problem is that you create a low latency system, in BizTalk that would translate to “Create low latency Hosts”. Now after reading up a bit on internet about how to create low latency hosts, I came across following posts
First of all the most important thing we did was that we downgraded the tracking in the BizTalk application. We only kept the minimum shape start and end times tracking enabled other than that everything was shut off
Next after reading through the links above I started playing around with following values
Under the General Settings
Refer How to Modify General Settings
I toyed around with the polling interval values as they are in direct correlation to how the BizTalk engine polls the data from the message box. There are two polling intervals available under general settings
a) Message Polling Interval
b)Orchestration polling interval, both these values are in ms.
Let us take a look at the description on MSDN site
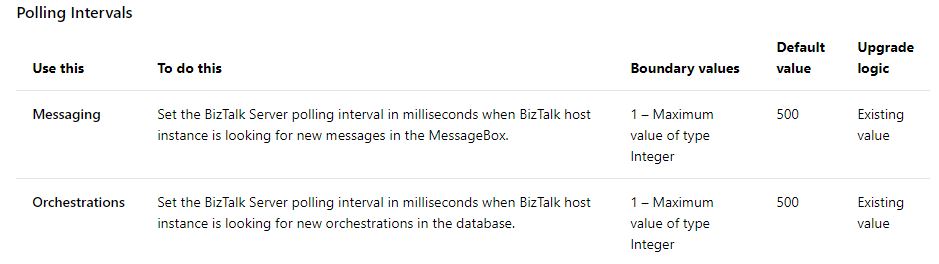
This presents following understanding
- For a Handler(Host Used on Send Ports)- Keep the messaging polling interval as little as possible and keep the Orchestrations polling interval to a high value.
- For an Application Host(Host Tied to Orchestrations): Reverse the above settings
Under Resource Based Throttling
Refer How to Modify Resource Based Throttling Settings
The main settings that play an important role in the latency scenario are
a)In-process messages
b)Internal message queue size
Let us take a look at what these settings are .
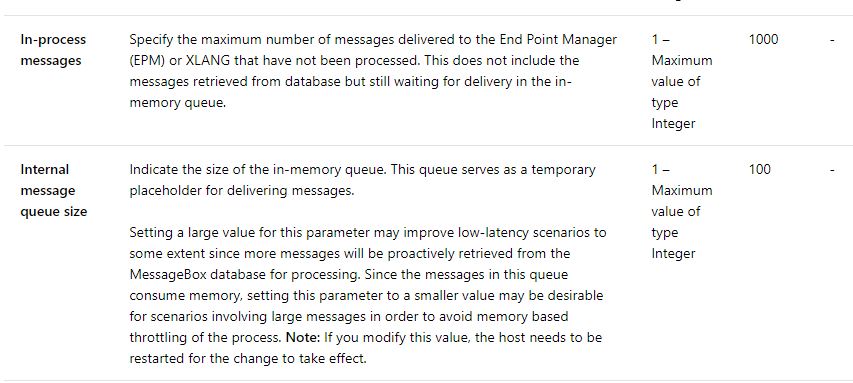
So we need an acceptable value higher that the default values specified for these settings.
Now we need to understand that there is no right or wrong or a fixed value that we can use for the settings discussed above. We need to play around with these values and see what works for us
This is what I ended up doing in my environment
For A Handler ( Host attached to Send Ports)
- Messaging Polling interval changed from 500 to 50 ms
- Orchestration polling interval changed from 500 to 150000 ms
For an Application Host (Host attached to Orchestrations)
- Messaging Polling interval changed from 500 to 150000 ms
- Orchestration Polling Interval changed from 500 to 50 ms
And for all the hosts related to this application, following changes were made in the resource based throttling.
- In-Process messages : Changed from 1000 to 10000
- Internal Message Queue changed from 100 to 1000
After these changes following were the observations
| Parameter(ms)- Avg | Without Low Latency Hosts | With Low Latency Hosts | % Gain |
| SP execution Time | 13150 | 1100 | 94 |
| Outbound Adapter Latency | 10347 | 100 | 99 |
| Inbound Latency | 1318 | 70 | 94.68 |
| LOB Time | 1521 | 500 | 67.12 |
Learnings
- Enable tracking only when required. But to track the basic flow, keep the bare minimum tracking enabled
- Creating low latency hosts when fast responses are expected.
- How the LOB Time counter works